Fondamentaux des modèles d'actions
API
Bienvenue dans le guide Stock Pattern Fundamentals ! En tant que nouvel investisseur, il est important de comprendre les performances d'une entreprise avant d'investir. L'application Wallet peut vous y aider en vous fournissant une représentation visuelle des fondamentaux d'une entreprise par le biais d'un ensemble de graphiques. Cependant, avant de se plonger dans les graphiques, il est important de comprendre ce qu'ils signifient.
Pour comprendre le fonctionnement des graphiques, il faut comprendre les fondamentaux d'une action. L'application Wallet permet à l'utilisateur de visualiser les fondamentaux à l'aide d'une simple arborescence.
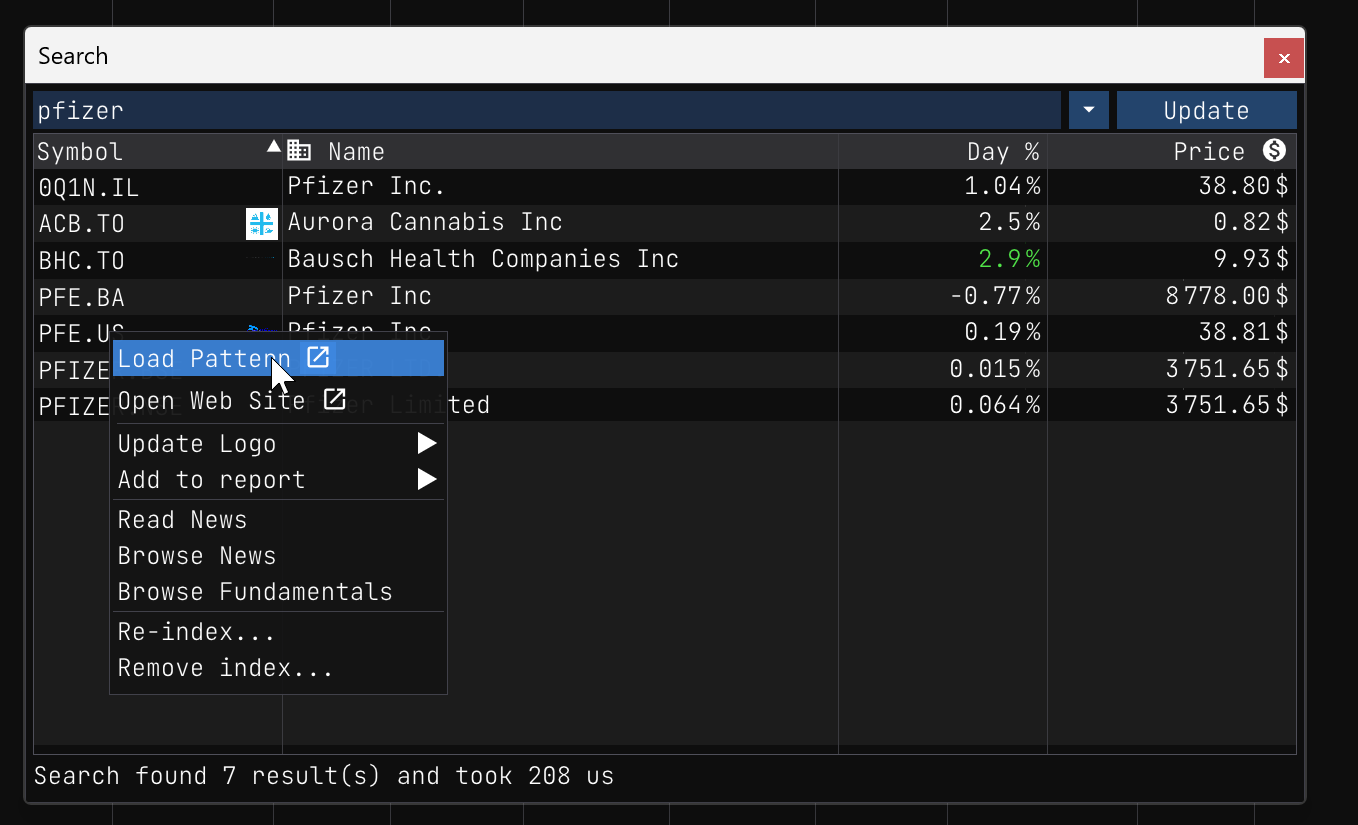
Pour commencer, vous devez ouvrir la vue du modèle pour une action particulière. Vous pouvez accéder à cette vue à partir du rapport ou de la recherche.
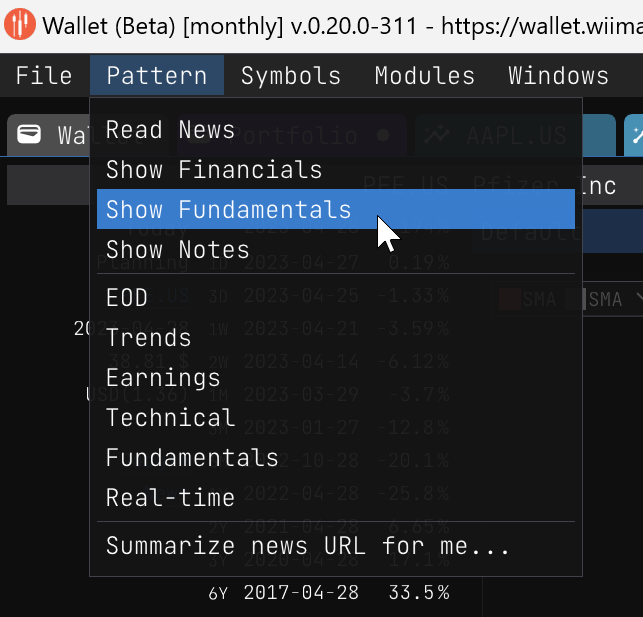
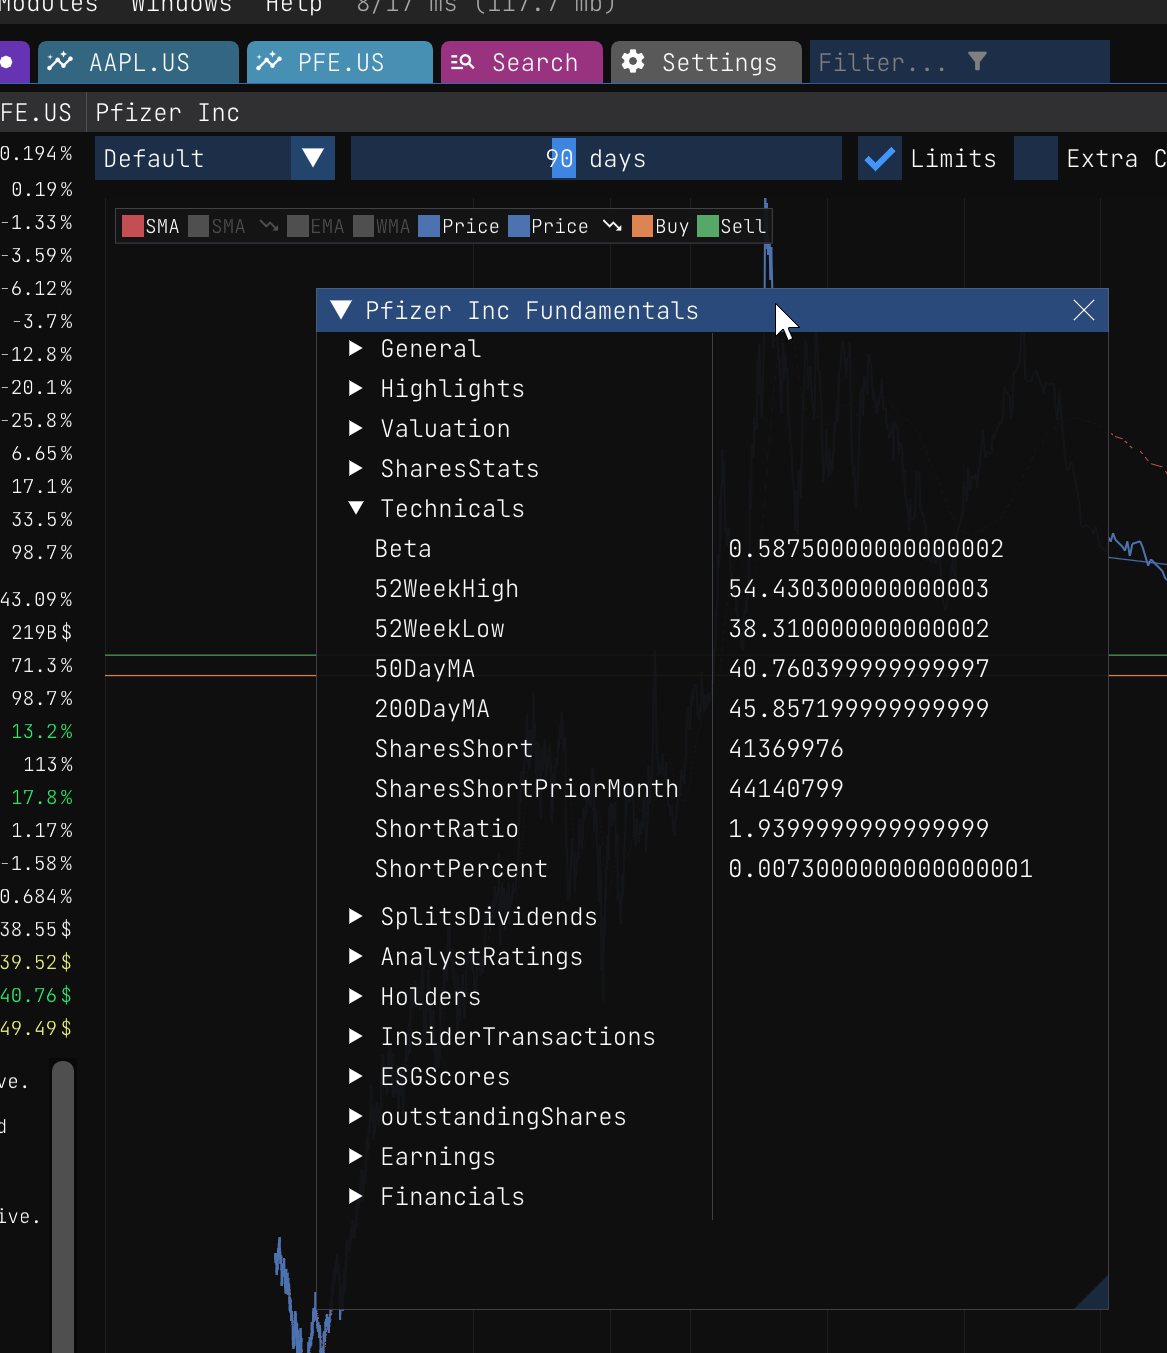
Une fois la vue de profil ouverte, vous pouvez cliquer sur l'élément de menu Pattern/Show Fundamentals pour ouvrir la vue des fondamentaux. Vous verrez alors une arborescence sur la gauche et les valeurs brutes des fondamentaux sur la droite.
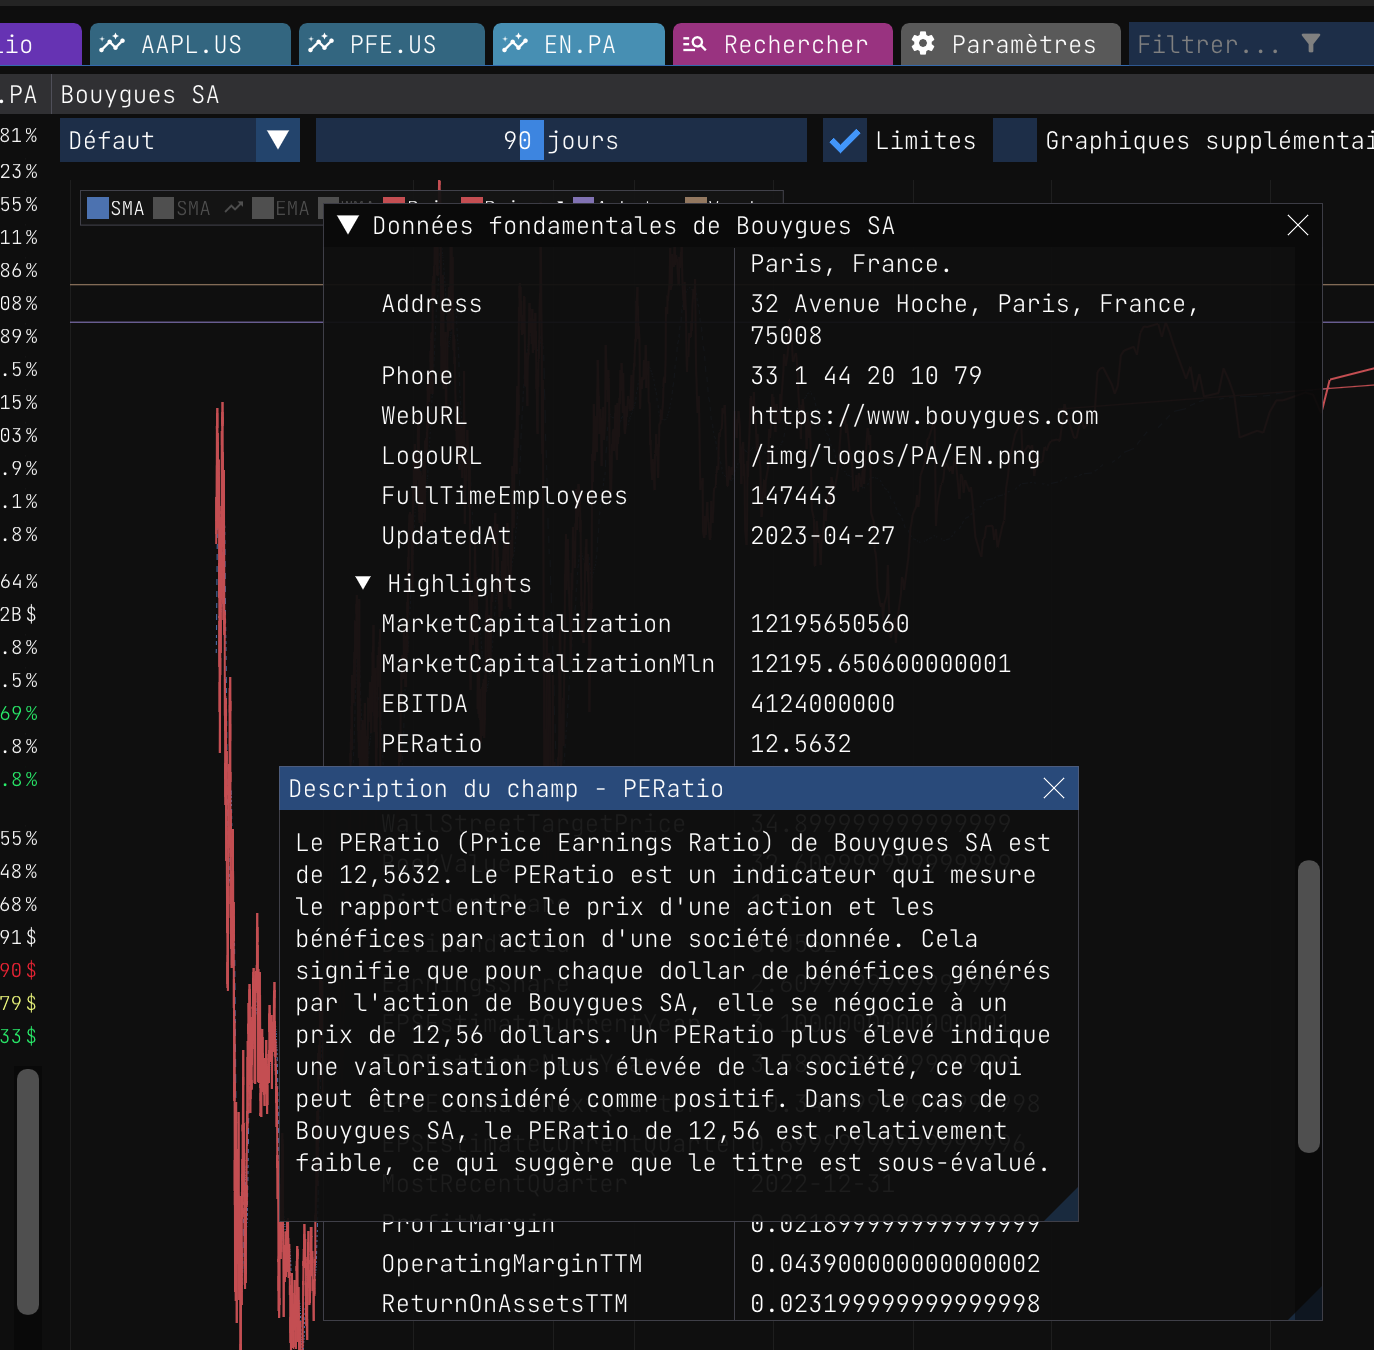
Ce n'est pas grave si vous ne comprenez pas tous les principes fondamentaux au début. Vous pouvez apprendre au fur et à mesure ! L'application Wallet offre un moyen simple d'obtenir plus d'informations sur un champ particulier.
Il suffit de cliquer sur l'étiquette du champ qui vous intéresse pour faire apparaître une fenêtre contenant plus d'informations sur ce champ dans le contexte de l'action en cours.
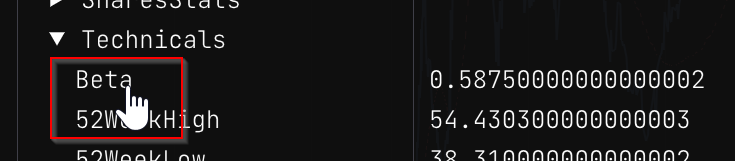
L'application Wallet ouvrira une petite fenêtre et affichera les informations sur le champ sélectionné dans le contexte de l'action en cours.
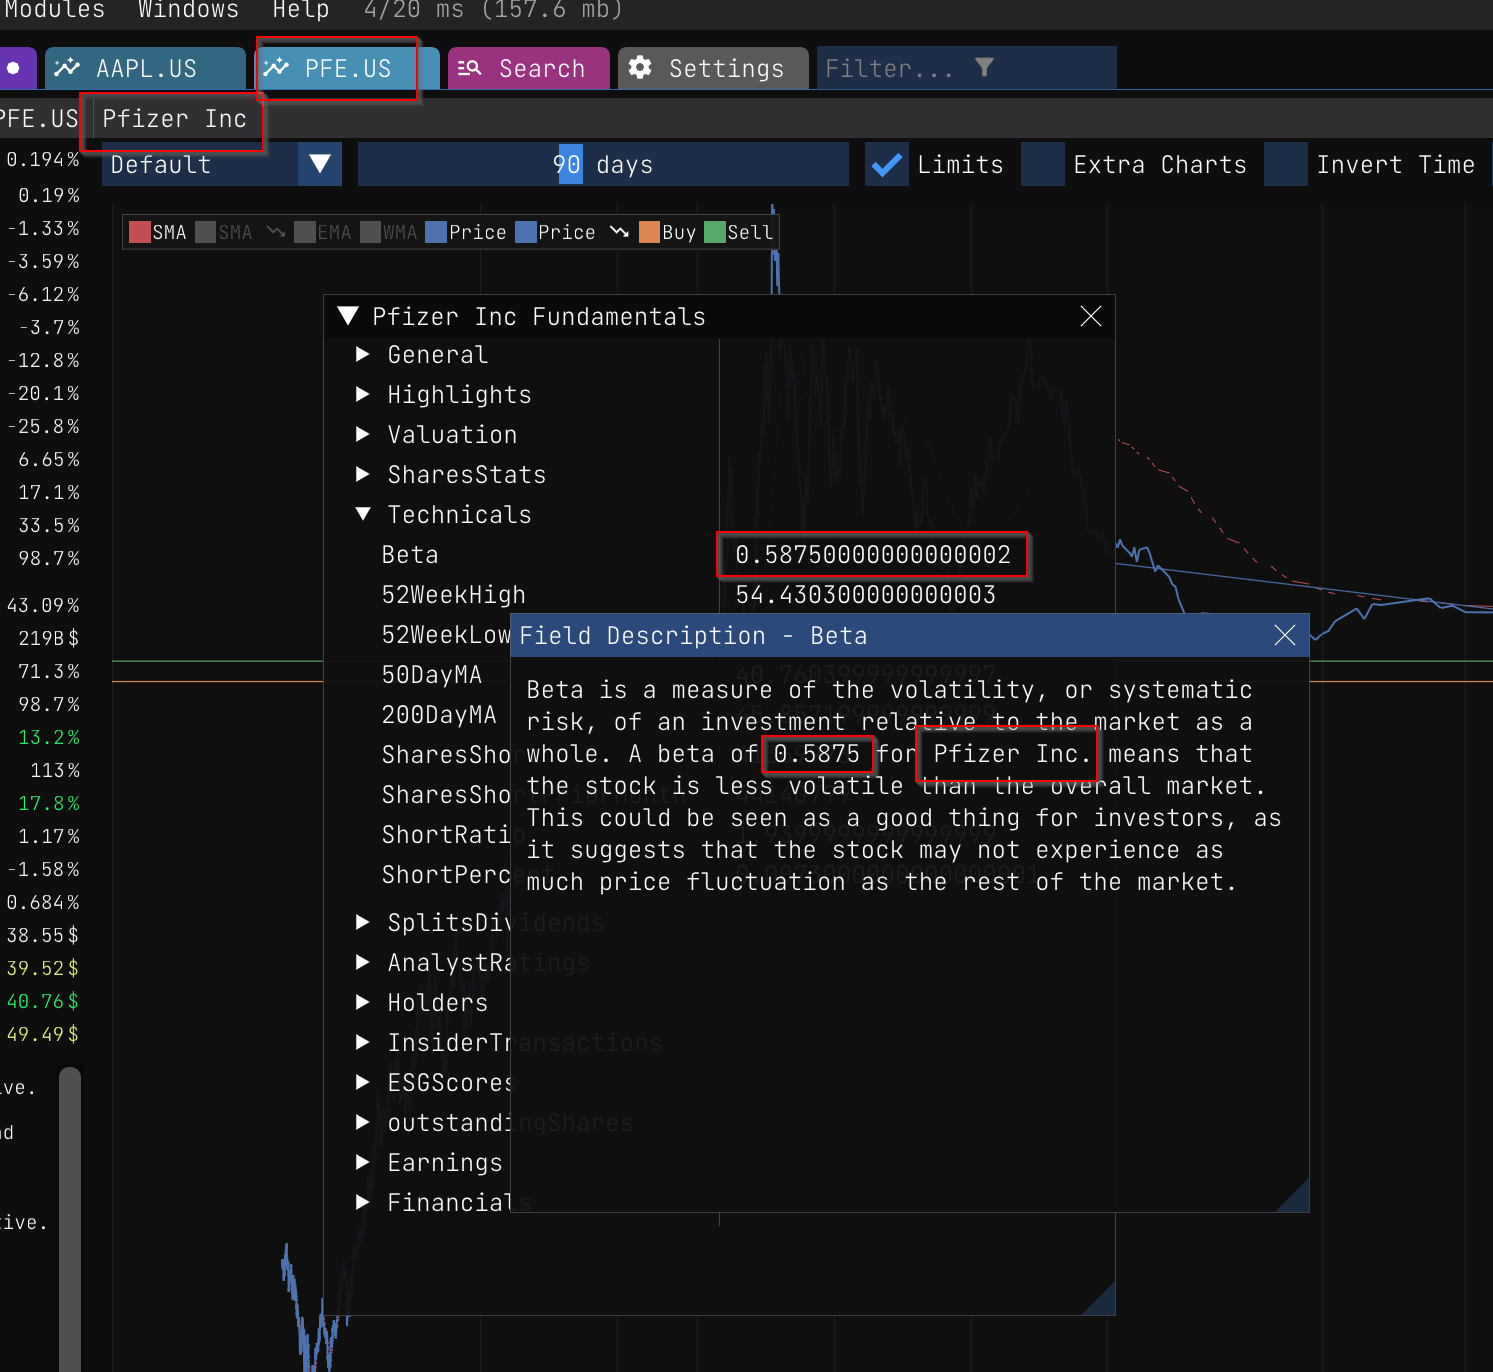
N'est-ce pas génial ? Lorsque vous avez fini de lire les informations sur le champ, vous pouvez simplement cliquer sur le bouton "X" pour fermer la fenêtre. Mais puisque c'est si cool, montrons un autre exemple.
En comprenant les fondamentaux d'une entreprise, vous pouvez prendre des décisions d'investissement éclairées qui s'inscrivent dans votre stratégie d'investissement. Voyons comment l'application Wallet peut vous aider à mieux comprendre un domaine particulier.
Vous pouvez trouver des informations supplémentaires sur les données fondamentales expliquées ici.